Paediatric Percentile Charts
Ctrl + Alt + W
Clinical > Percentile Charts (via the Clinical Window)
Tools > Tool Box > Weight (via the Clinical Window)
The Paediatric Percentile Chart tool is available to patients under the age of eighteen years. For older patients this tab reads 'Weight', and they can access the chart via Clinical > Percentile Charts. See Weight for more information.
Note:
the percentile data show on this chart is not available to gender-neutral patients.
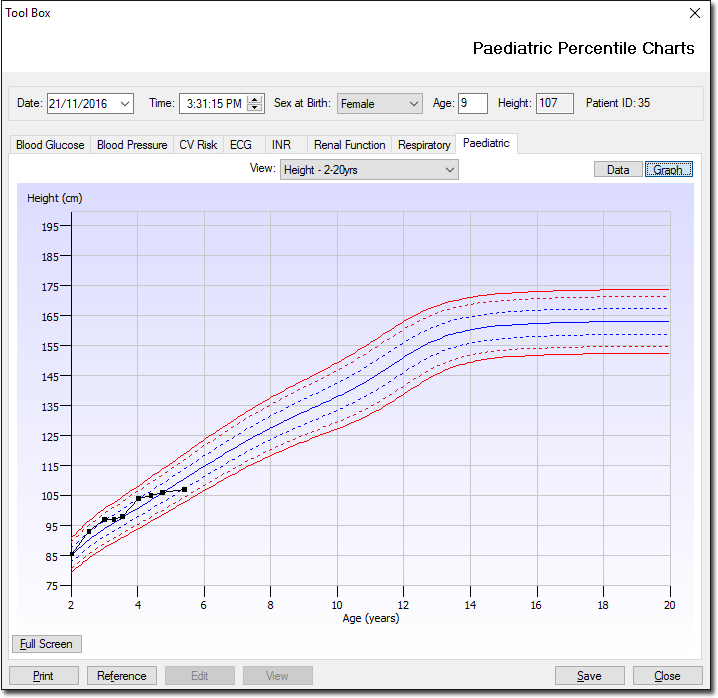
- The display initially shows the height graph for the patient's age and sex at birth, with alternate charts available by selecting different combinations of graph type and sex at birth.
- Changing the sex at birth allows you to view different percentile data against the same chart.
- The patient's data is displayed as a black line.
- The data used to produce the Clinical Paediatric Percentile Charts has been obtained from the CDC Growth Charts produced in 2000.
Save Display the patient's record as a list of data. Graph Display the patient's record as a graph. Clear Clears any data you enter into the Current Measurements section of the window. This button is only available once the Data button has been clicked. Full Screen Expands the graph to fit the window. This button is only available once the Graph button has been clicked. Print Prints the patient's Paediatric Percentile Chart data. Note that this prints with the applied filter and with/without the graph depending on whether you print via the Data or Graph page. Reference Calls a window containing reference information. Edit Not applicable to Paediatric Percentile Charts. View Not applicable to Paediatric Percentile Charts. Save Save data to the patient's record.