Location Distribution
The ePIP Shared Health Summary Calculator also provides a facility for viewing the distribution of Shared Health Summaries you have uploaded, per location.
Using the example below, we can see that this practice has uploaded 4 Shared Health
Summaries for August.
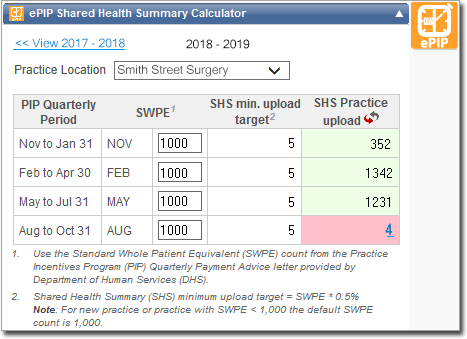
By clicking on the value in the SHS Practice upload column (in this example the
'4' ), we can display a table showing the distribution of uploads
per location.
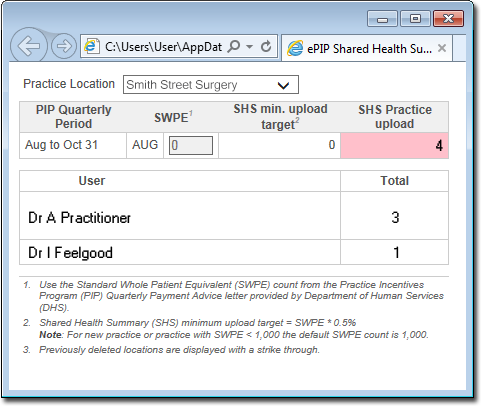
In our example, the table indicates:
- There were 4 uploads in total
- 3 of those uploads were performed by Dr A Practitioner.
- 1 of those uploads was performed by Dr I Feelgood.
Tip:
If integrated, the Location data is sourced from the
Location field in the practitioner's record in Pracsoft.