MedicalDirector Insights Overview
MedicalDirector Insights analyses your MedicalDirector patient database, and generates its own separate database. It saves this database to the same server computer on which your MedicalDirector patient database resides. It uses this database as the source of the data sets it displays to you.
MedicalDirector Insights is downloaded to your practice via MedicalDirector Automatic Update, and installed onto every computer running Clinical.
Like the MedicalDirector Insights
database, the MedicalDirector Insights
application is separate to the Clinical application,
and is run via its own ![]() MedicalDirector Insights icon
located on your Windows Desktop.
MedicalDirector Insights icon
located on your Windows Desktop.
When you run MedicalDirector Insights for the first time, it prompts you to create a collection of your patient data - statistics about your patient database captured at that moment in time. You can create an unlimited number of collections, switching between them at any time, and every collection is available to every user on every Clinical computer.
Any data you view within MedicalDirector Insights is based on the collection currently selected by you. Other users on other computers can view and work with the same collection as you, or other collections of their choosing, simultaneously.
MedicalDirector Insights Components
| Callout | Element | Description |
|---|---|---|
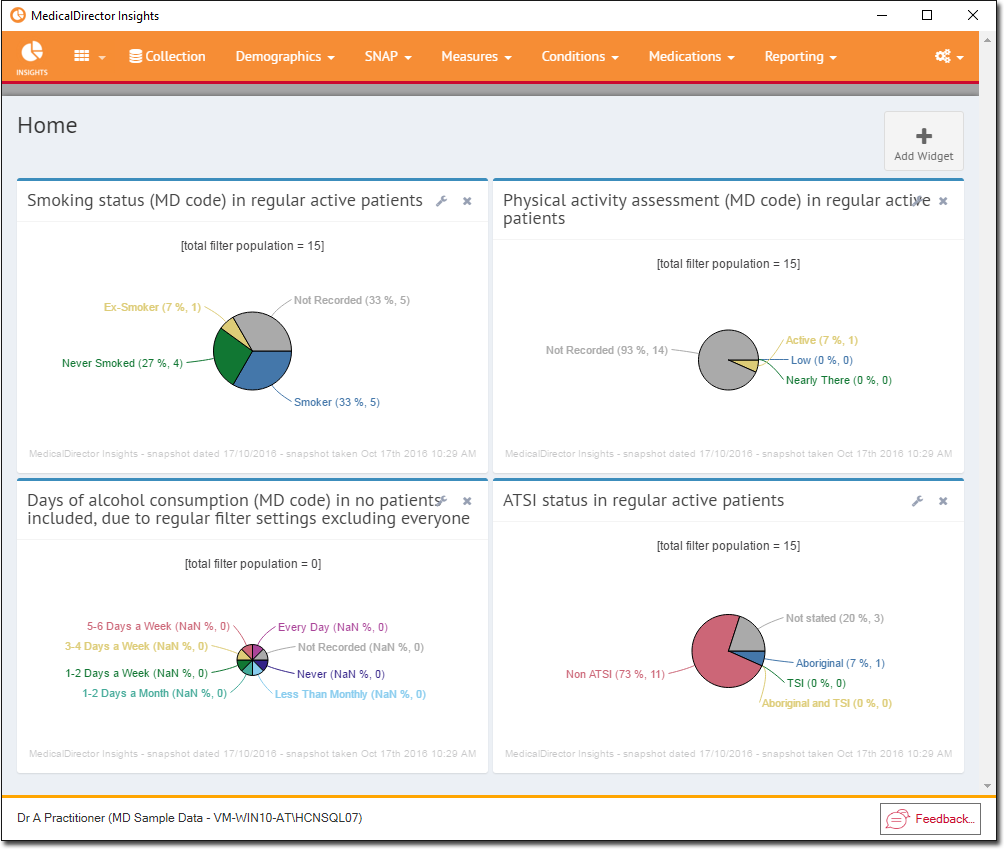
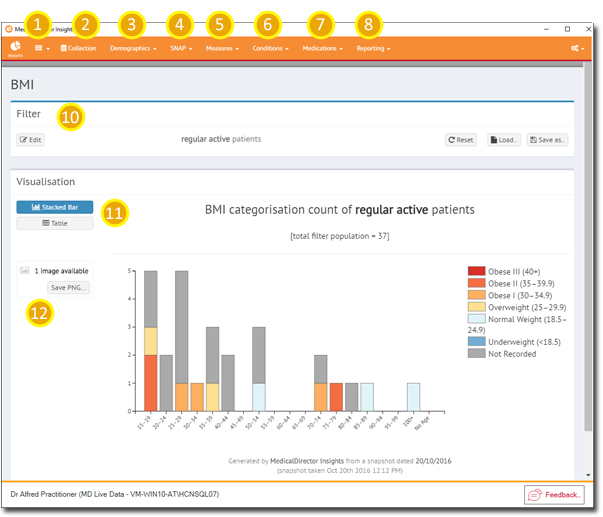
| 1. | Dashboard: | The default Dashboard displays charts of popular data sets, but it can be modified. You can also create your own Dashboards. This screen also provides information regarding the specifications of the current collection. |
| 2. | Collection: | Your set of collections. |
| 3. | Demographics: | Charts of Age (RACGP), Age (ABS), Gender, Indigenous, and a 'population pyramid'. |
| 4. | SNAP: | Charts of the popular data sets, 'smoking status', 'alcohol consumption' ,'AUDIT-C', and 'physical activity assessment'. |
| 5. | Measures: | BMI categorisation count, HbA1c, Waist Circumference, and Absolute CVD. |
| 6. | Conditions: | Prevalence of cardiovascular conditions, diabetes, mental health issues, musculoskeletal issues, renal function, respiratory function, STI condition, miscellaneous. |
| 7. | Medications: | Prevalence of heart medications, respiratory medications, and antidiabetic medications. |
| 8. | Reporting: | A variety of reports, and a mechanism for submitting data to Health Data Portal. |
| 9. | Settings: | Data Set Specifications, Snapshot management, and Filter management. |
| 10. | Filter: | Where you configure a filter for the current data. You can also save filters here, or load saved filters. |
| 11. | Chart/Table: | Buttons for toggling the display mode of the current data between a table, and a chart/graph. |
| 12. | Save PNG: | Save the displayed data as a .PNG image file. This feature is not available to all visualisations. |