Add Widgets to a Dashboard
Before you begin
Procedure
-
Via the
 button; select the Dashboard you want to work on.
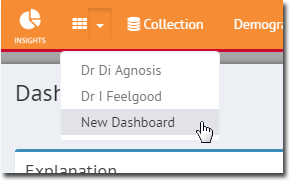
-
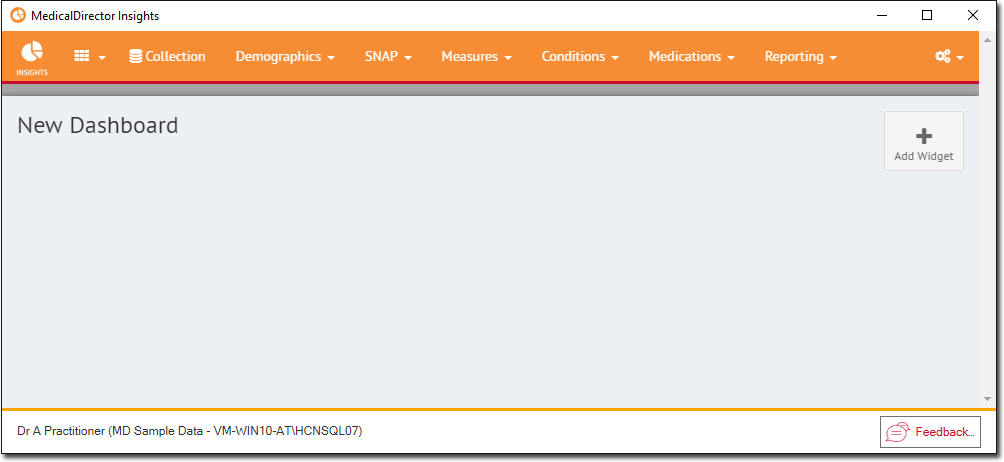
The Dashboard opens. If you are working on a new Dashboard you have just created, it will initially appear empty, as shown in our example below.
-
Click Add Widget to add a new Widget to the Dashboard.
-
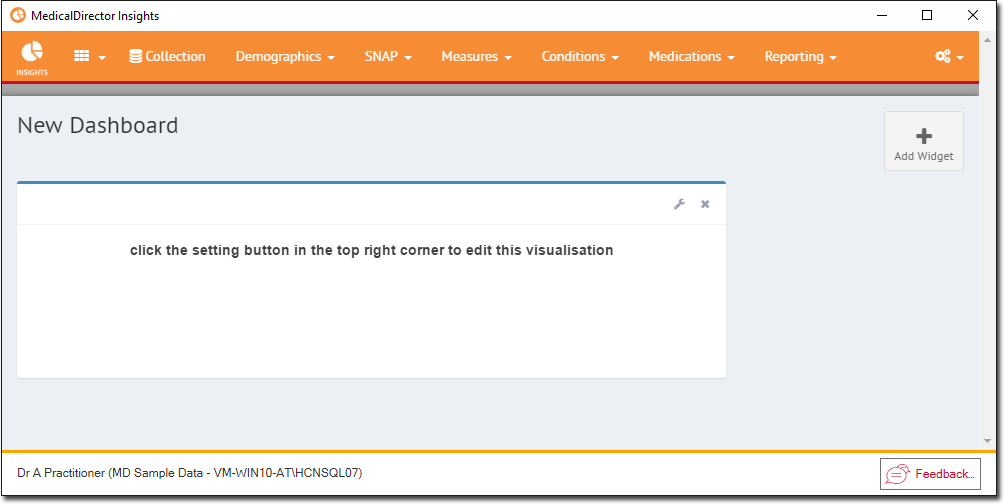
On the new Widget, locate and click
 to
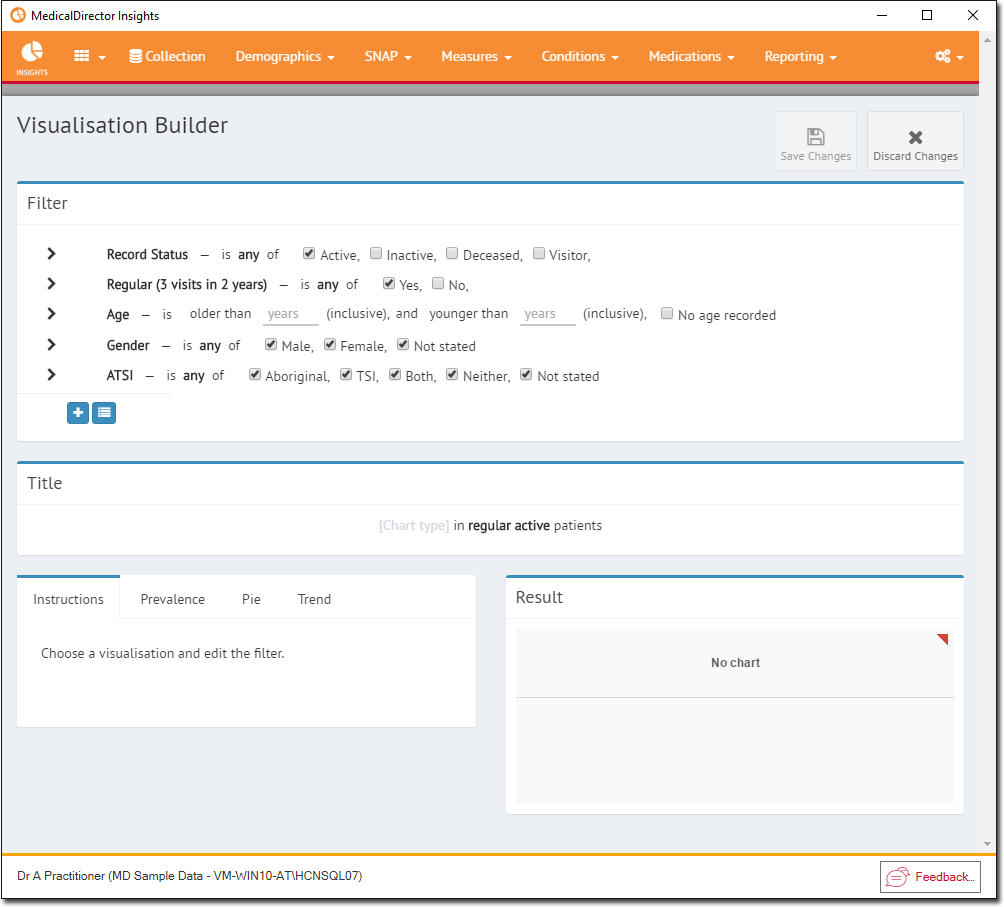
activate the Visualisation Builder for this Widget. The Visualisation Builder allows
you to specify the data set and appearance of the selected Widget.
to
activate the Visualisation Builder for this Widget. The Visualisation Builder allows
you to specify the data set and appearance of the selected Widget.
- Filter section: Provides the standard filtering criteria. Please see Filtering Data for more information on how to use this panel.
- Title section: A title for this Widget is created dynamically, based on the filtering criteria you select.
- Instructions section: Where you specify how you want the data presented i.e. as a percentage/proportion/trend.
- Result section: Where the resulting data is
displayed.