Choose a Visualisation - Prevalence
Before you begin
Procedure
-
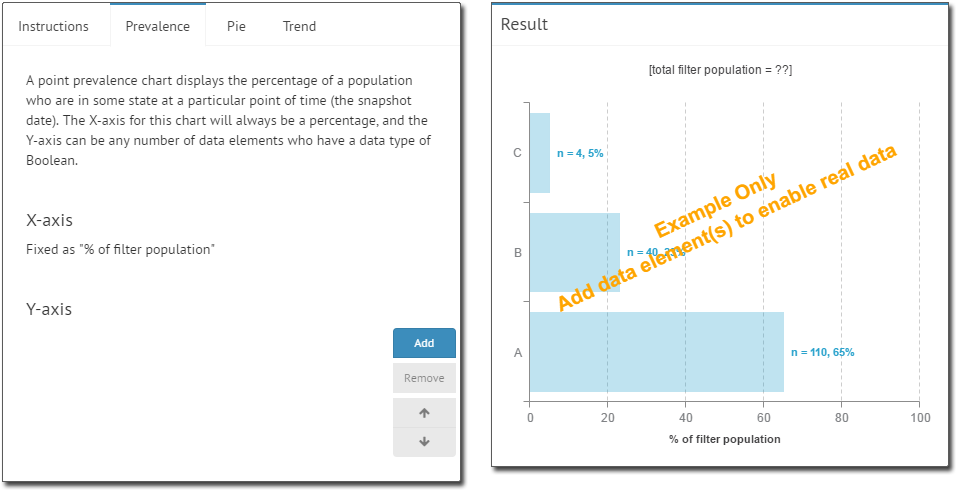
Select the Prevalence tab. Initially this tab will contain no data, as shown in our example below.
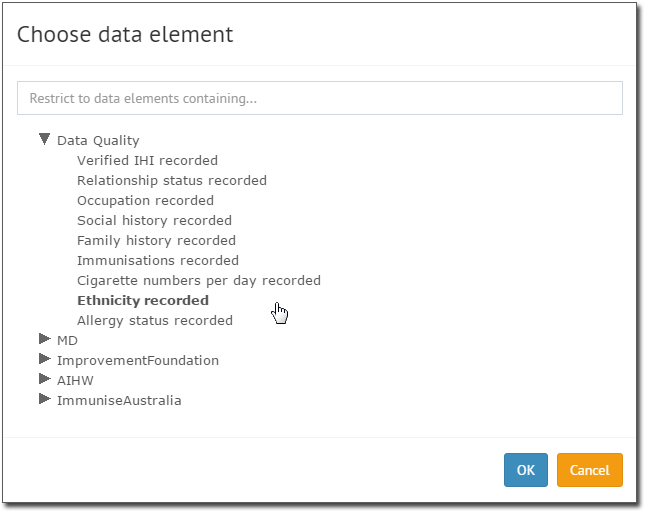
- Click Add to add a data element to examine. You will be prompted to select an element.
- Select an element.
In our example, we selected Ethnicity recorded.
-
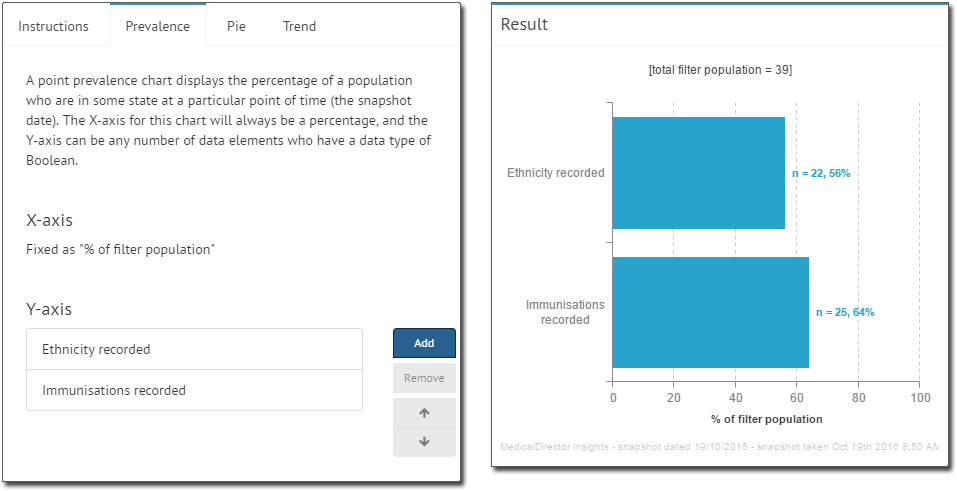
Click OK. You are returned to the Visualisation Builder,
where the Result section now displays your data.
- You can add more data elements as desired. In our example, we've added 'Immunisations recorded'.
- You can remove a data element by selecting it, and clicking Remove.
- Change the order in which elements are displayed by selecting one and clicking
 or
or  .
. -
- Ensure you click Save Changes to save the Widget before you close the Dashboard you are working on.