Choose a Visualisation - Pie
Before you begin
Procedure
-
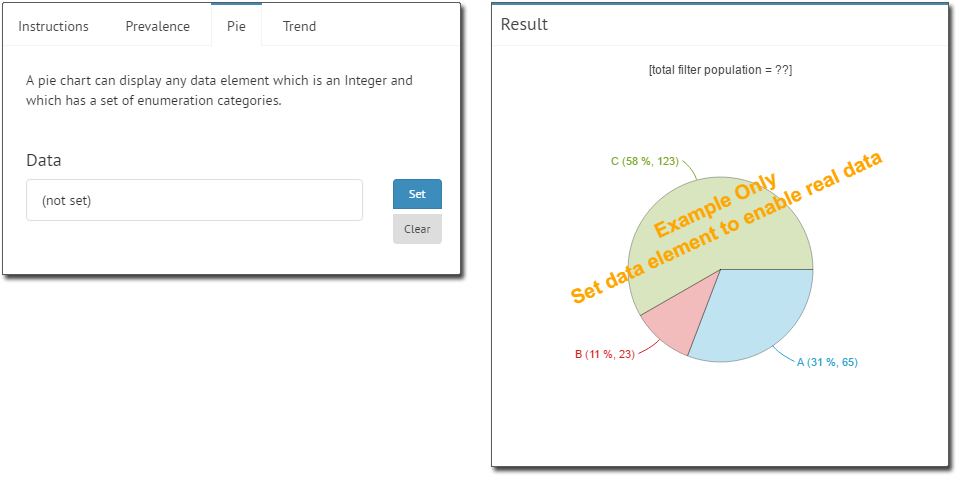
Select the Pie tab. Initially this tab will contain no data, as shown in our example below.
-
Click Set to add a data element to examine. You will be
prompted to select an element.
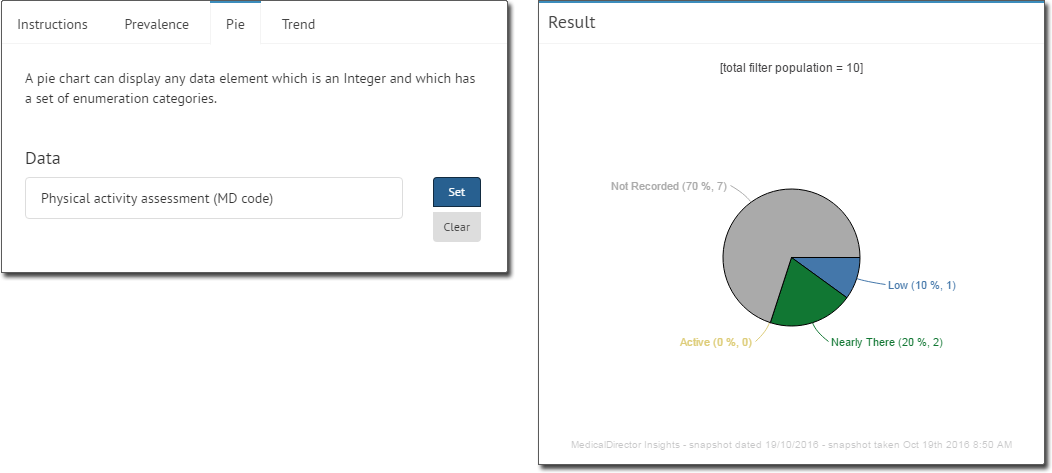
- Select an element. In our example, we selected Physical activity assessment (MD code).
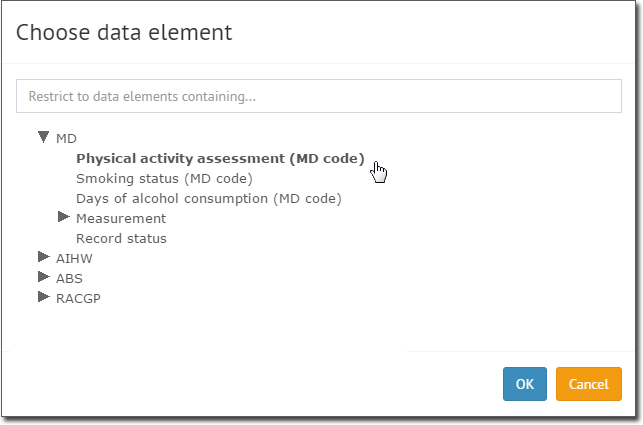
- Select an element. In our example, we selected Physical activity assessment (MD code).
-
Click OK. You are returned to the Visualisation Builder,
where the Result section now displays your data.
-
- Ensure you click Save Changes to save the Widget before you close the Dashboard you are working on.