
Paediatric Percentile Charts
Plot a child's development growth against population norms and track their growth progress.
To access the Paediatric Percentile Charts, use one of the following
methods:
In the Paediatric Percentile Charts:
Note:
Data
included:The percentile data shown on this chart is not
available to gender-neutral patients.
- Length 0-3yrs
- Weight 0-3yrs
- Head Circ 0-3yrs
- Height 2-18yrs
- Weight 2-18yrs
In the Paediatric Percentile Charts:
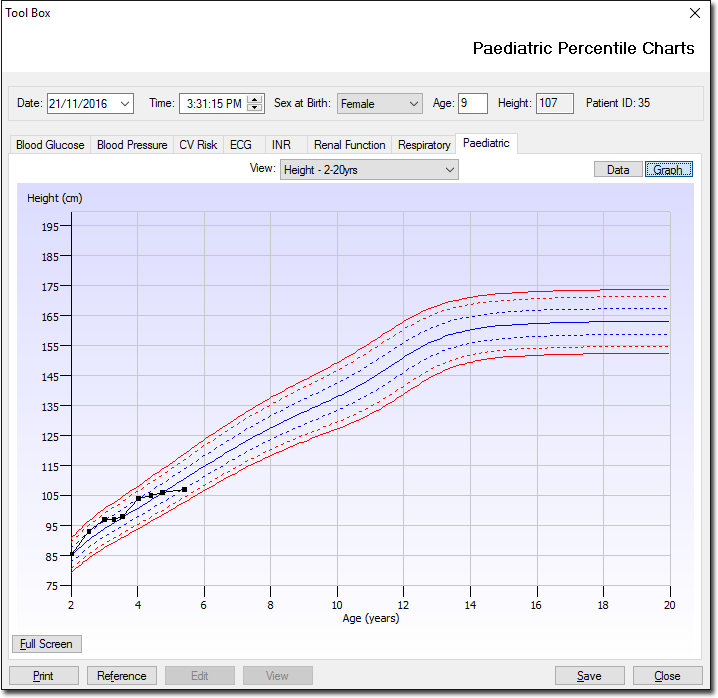
- Initially displays the height graph for the patient's age and sex at birth, with alternative charts available by selecting different combinations of graph type and sex at birth.
- Allows you to change the sex at birth and view the different percentile data against the same chart.
- The patient's data is displayed as a black line.
- The data used to produce the Clinical Paediatric Percentile Charts are obtained from the CDC Growth Charts produced in 2000.
| Fields | Description |
|---|---|
| Data | Displays the patient's record as a list of data. |
| Graph | Displays the patient's record as a graph. |
| Clear | Clears any data you enter into the Current Measurements section of the window. This button is available on the Data tab. |
| Full Screen | Expands the graph to fit the window. This button is only available when you are on the Graph tab. |
| Prints the patient's Paediatric Percentile Chart
data. Note: It prints with the applied filter and
with or without the graph depending on whether you print via the
Data or Graph
page. |
|
| Reference | Calls a window containing reference information. |
| Edit | This option is inactive for Paediatric Percentile Charts. |
| View | This option is inactive for Paediatric Percentile Charts. |
| Save | Saves data to the patient's record. |